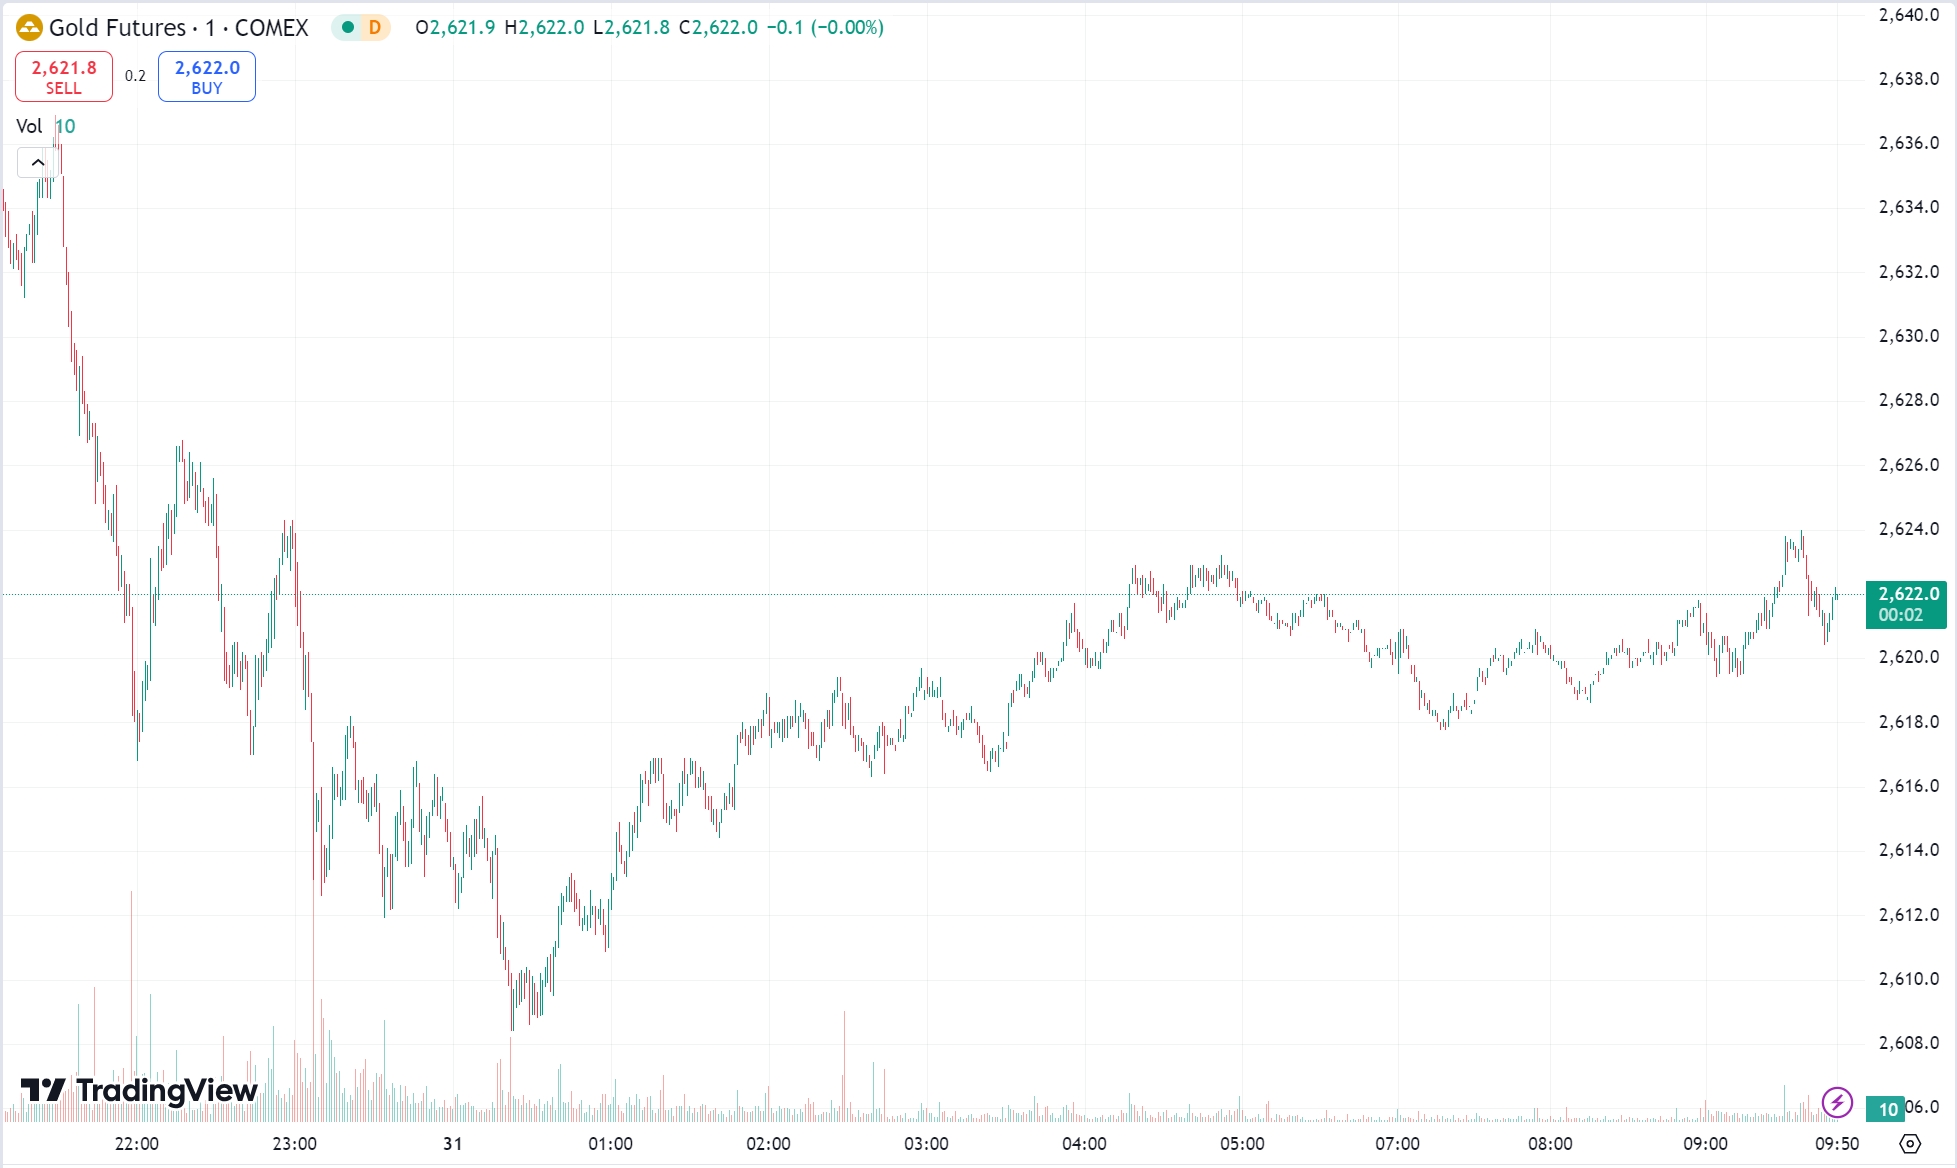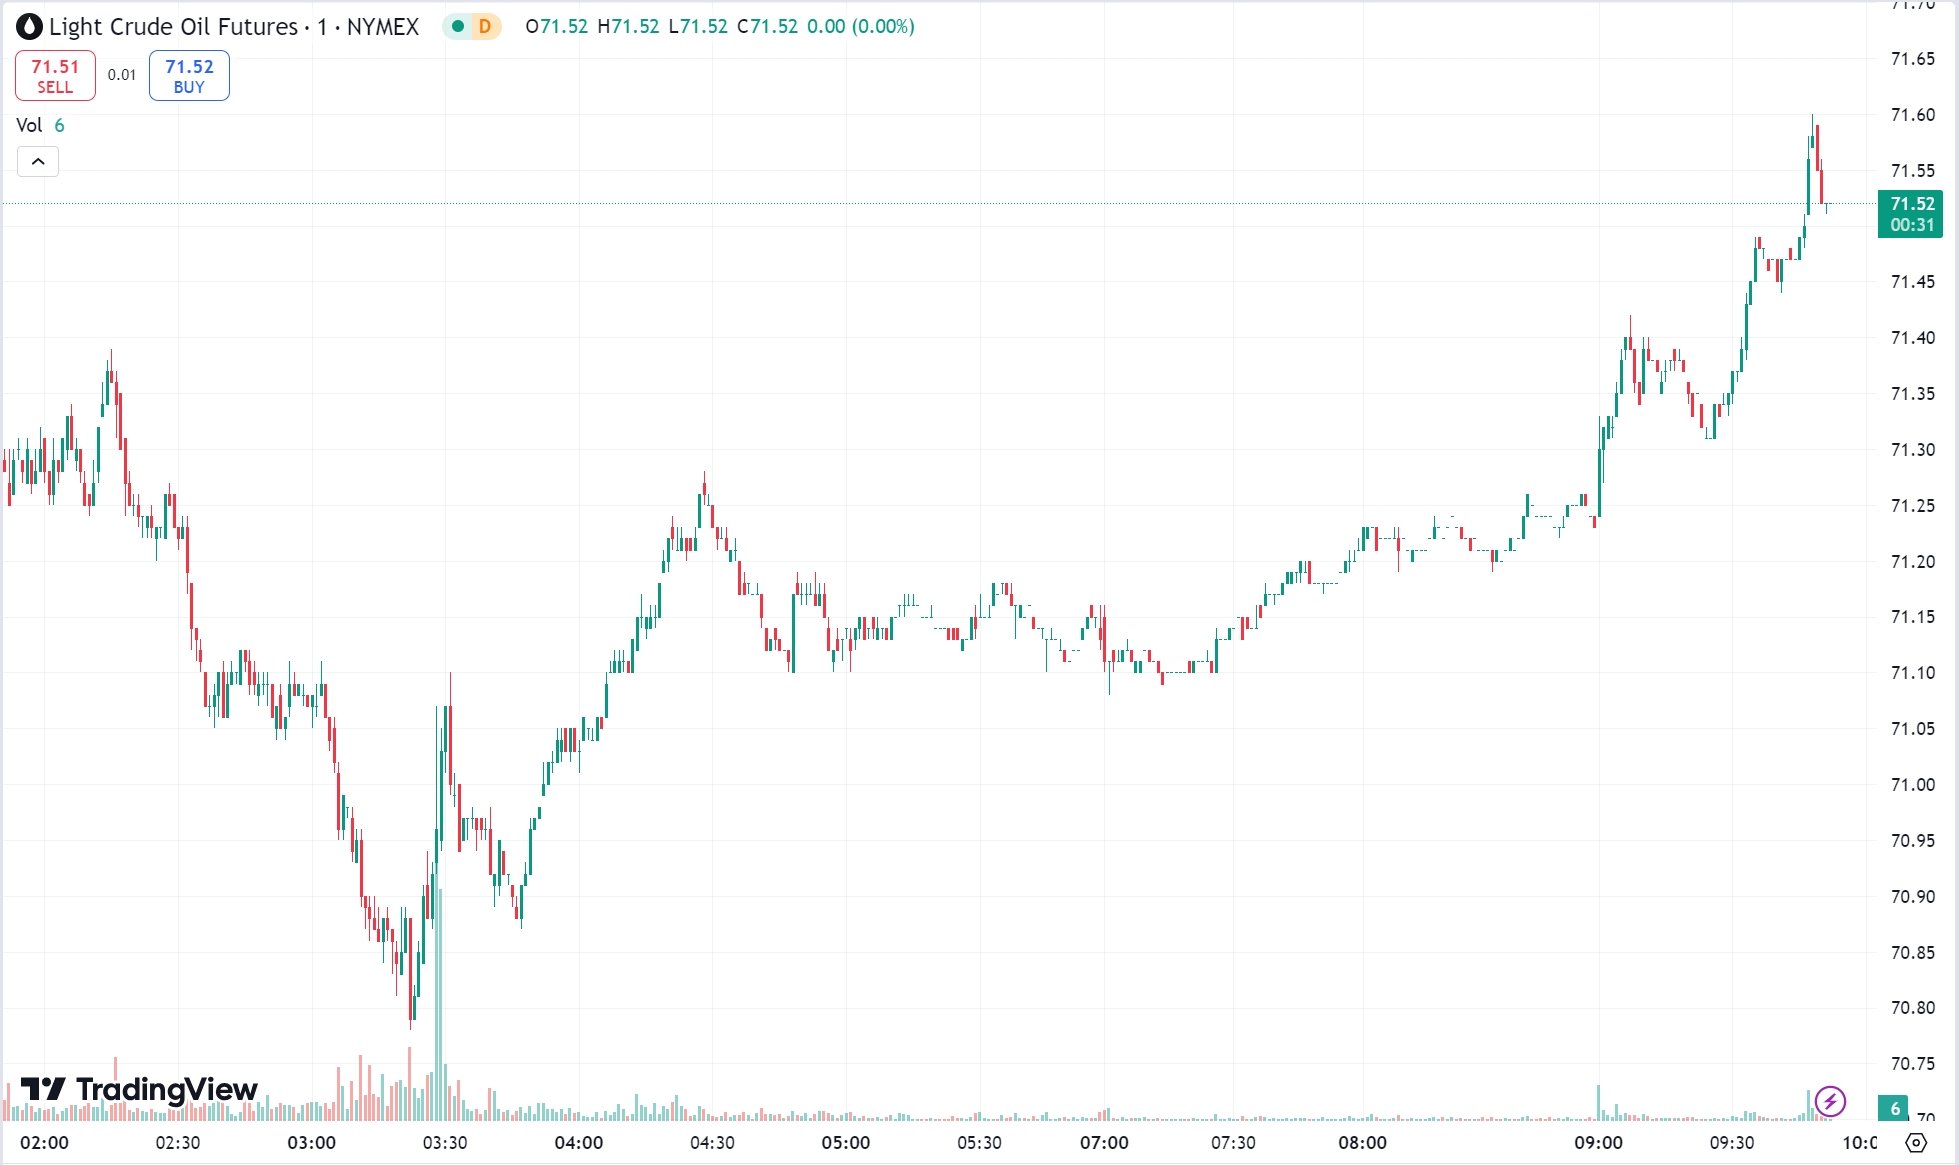
On Monday, gold came under pressure as the US dollar and Treasury yields remained elevated. Prices briefly fell below the $2600 mark, hitting their lowest level since December 20, before recovering slightly to close at $2605.71 per ounce, below the key 100-day moving average of $2619. Crude oil prices edged higher in thin year-end trading, supported by expectations that colder temperatures in Europe and the US will boost diesel demand. WTI crude futures settled near $71 per barrel.
Gold Market Overview
Gold prices declined on Monday as the US dollar and Treasury yields stayed strong. Intraday, gold dipped below $2600, marking a new low since December 20, before closing above that level but below the key 100-day moving average at $2619. By the end of the session, gold was down 0.60%, settling at $2605.71 per ounce.
Key Drivers
- US Dollar Index: The dollar continued to strengthen, rising 0.07% to 108.068, close to its two-year high. The index has gained 6.7% this year.
- Treasury Yields: The 10-year Treasury yield fell 8.06 basis points to 4.5447% on Monday but remained elevated. Since October, expectations for slower Fed rate cuts have driven yields significantly higher from 3.8%.
Despite recent pressure, gold has gained nearly 27% this year, reaching an all-time high of $2790.15 per ounce on October 31, buoyed by geopolitical risks and the Fed’s policy shift toward easing.
Market Insights
Peter Grant, Vice President and Senior Metals Strategist at Zaner Metals, remarked, “Geopolitical tensions are likely to persist into next year, with central banks continuing to buy gold. Additionally, a return of the Trump administration could exacerbate US debt and fiscal deficits, further driving safe-haven demand for gold.”
Technical Analysis of Gold
On Monday, gold experienced a one-sided decline amid volatile trading. After a brief rebound during the Asian and European sessions, prices faced resistance at $2628 and began to drop. In the US session, gold fell sharply below the key support level of $2610, accelerating its decline to $2595 before recovering slightly to close near $2605. The daily candlestick formed a bearish engulfing pattern, indicating renewed bearish momentum as gold retreated from previous highs at $2638.

Today’s Focus & Strategy
- Trading Strategy: Favor short positions during rebounds, with buying on pullbacks as a secondary approach.
- Resistance Levels: 2618-2623
- Support Levels: 2590-2585
Crude Oil Market Overview
On Monday, crude oil prices edged higher in thin year-end trading as investors bet that colder weather in Europe and the US will boost diesel demand. WTI February crude futures gained $0.39 (+0.55%) to settle at $70.99 per barrel, while Brent February crude futures rose $0.60 (+0.81%) to close at $74.39 per barrel.
Key Drivers
- Weather Outlook: Data from the London Stock Exchange Group (LSEG) projected US heating degree days (a measure of heating energy demand) to rise to 499 over the next two weeks, up from an earlier forecast of 399. LSEG meteorologists also anticipate significantly colder temperatures in Europe in January.
- Natural Gas Surge: US natural gas futures jumped 17% on Monday, reaching their highest levels since January 2023, driven by cold weather expectations and rising export demand.
- Diesel Demand: TACenergy, a fuel distributor, noted that diesel prices have been leading gains in refined products, as colder temperatures drive increased demand for diesel, which can substitute for natural gas in heating applications.
Inventory Outlook
Oil traders are also closely watching US crude inventory data. A preliminary Reuters survey on Monday suggested that US crude inventories fell by approximately 3 million barrels last week. For the week ending December 20, crude inventories dropped by 4.237 million barrels, far exceeding expectations of a 1.867 million-barrel decline. Seasonal demand during the holiday period also boosted fuel consumption, with both Brent and WTI crude rising over 1% last week.
Technical Analysis of Crude Oil
On Monday, oil prices followed a “dip-and-rebound” pattern. During the Asian and European sessions, prices briefly dipped to $70.2 before stabilizing and climbing higher. The US session saw continued strength, with prices breaking above the $71 mark and briefly touching $71.5 before settling near that level. The daily candlestick formed a bullish breakout pattern, signaling a return to strong upward momentum as WTI reclaimed the $71 threshold.

Today’s Focus & Strategy
- Trading Strategy: Focus on buying during pullbacks, with selling on rallies as a secondary approach.
- Resistance Levels: 72.1-72.6
- Support Levels: 70.0-69.5
Risk Disclosure
Securities, Futures, CFDs and other financial products involve high risks due to the fluctuation in the value and prices of the underlying financial instruments. Due to the adverse and unpredictable market movements, large losses exceeding your initial investment could incur within a short period of time.
Please make sure you fully understand the risks of trading with the respective financial instrument before engaging in any transactions with us. You should seek independent professional advice if you do not understand the risks explained herein.
Disclaimer
This information contained in this blog is for general reference only and is not intended as investment advice, a recommendation, an offer, or an invitation to buy or sell any financial instruments. It does not consider any specific recipient’s investment objectives or financial situation. Past performance references are not reliable indicators of future performance. Doo Prime and its affiliates make no representations or warranties about the accuracy or completeness of this information and accept no liability for any losses or damages resulting from its use or from any investments made based on it.
The above information should not be used or considered as the basis for any trading decisions or as an invitation to engage in any transaction. Doo Prime does not guarantee the accuracy or completeness of this report and assumes no responsibility for any losses resulting from the use of this report. Do not rely on this report to replace your independent judgment. The market is risky, and investments should be made with caution.


