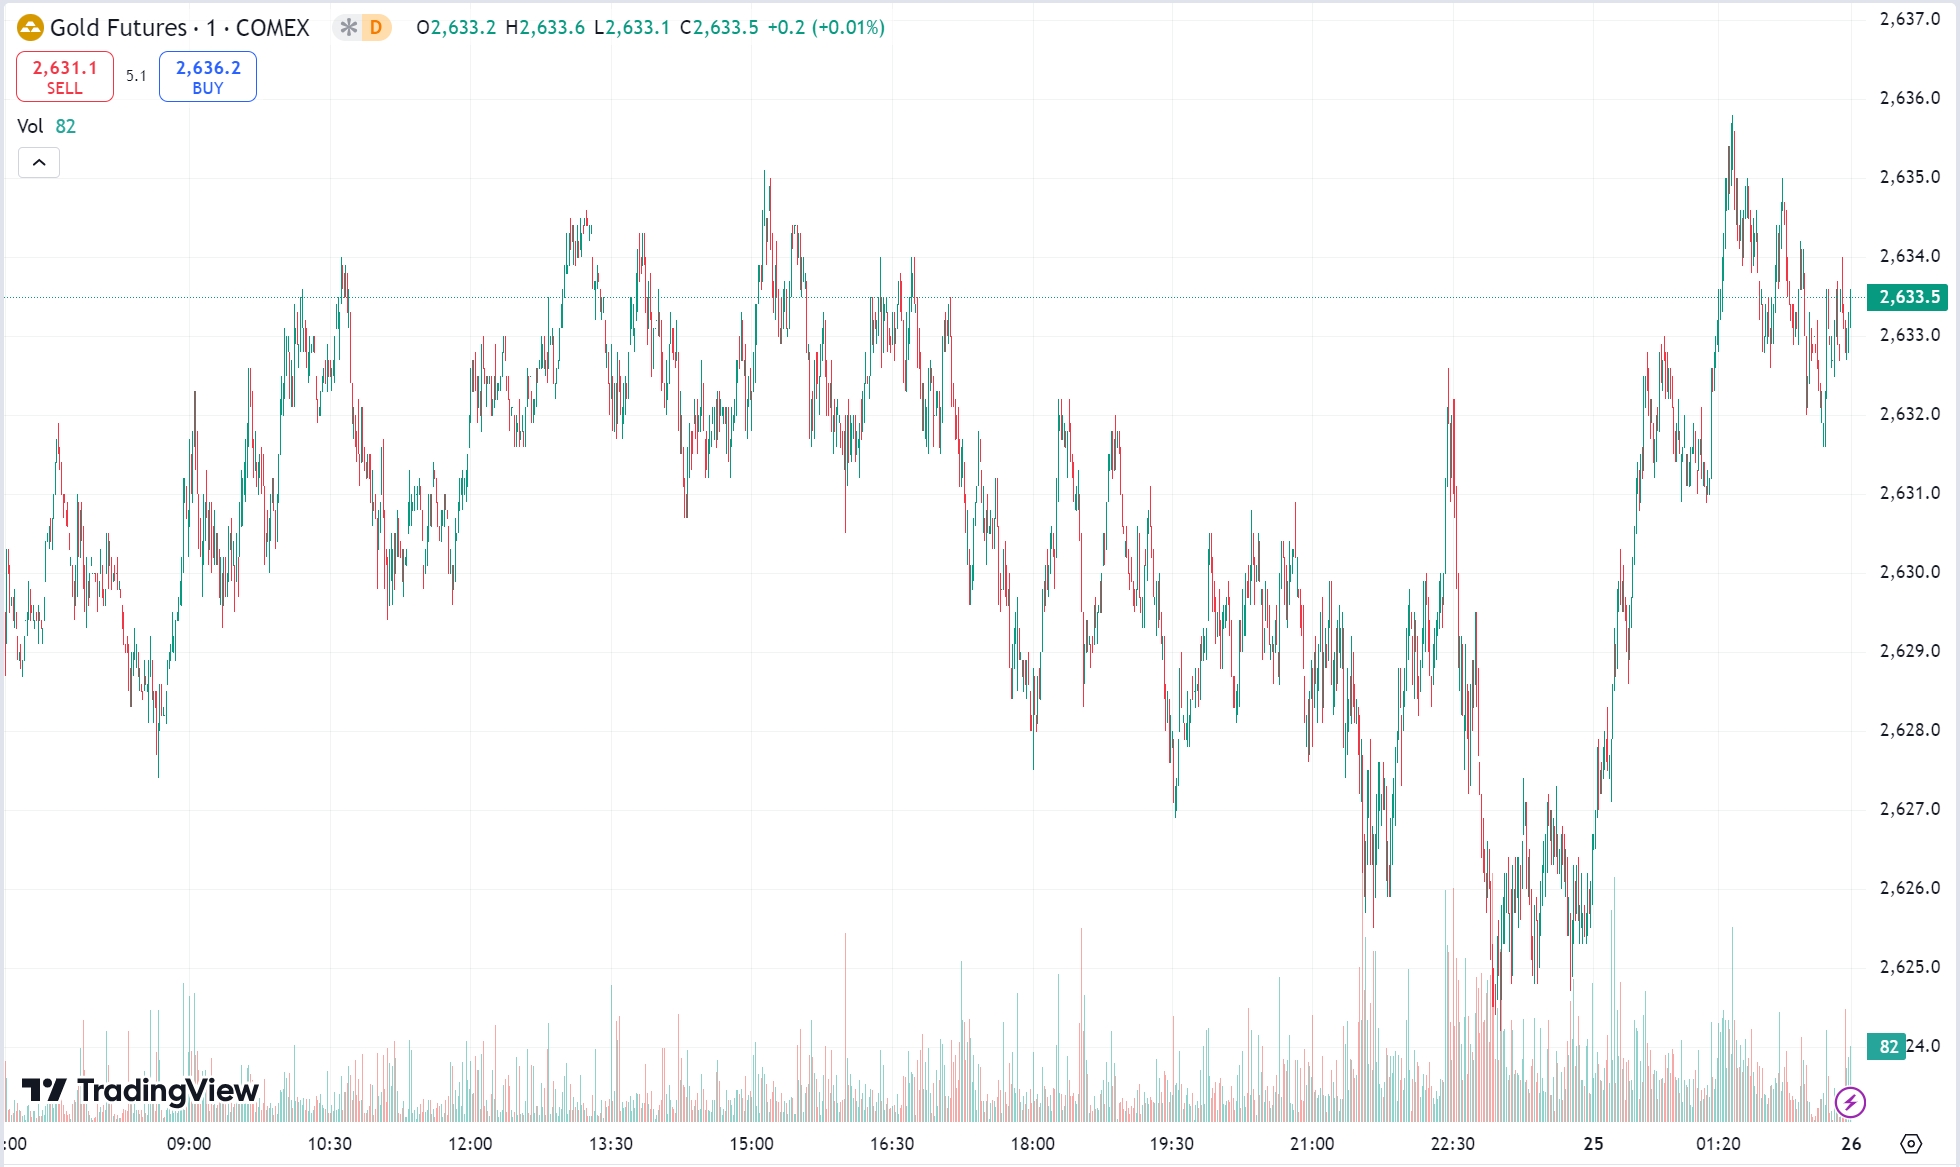
On Tuesday, trading activity was relatively subdued ahead of the Christmas holiday. Gold prices remained stable within a narrow range, with an intraday fluctuation of just $11, closing up 0.17% at $2,617.27 per ounce. Crude oil reversed its previous losses, gaining over 1% as short-term prospects improved and supply tightened slightly. WTI crude futures closed above the $70 mark.
Due to the Christmas holiday on Wednesday (December 25), trading for precious metals and crude oil on CME Group, as well as Brent crude futures on ICE, will be suspended for the entire day.
Gold Market Overview
On Tuesday, gold prices remained stable within a narrow range ahead of the Christmas holiday. Trading was relatively subdued, with daily price fluctuations limited to about $11. By the close, gold rose 0.17%, settling at $2,617.27 per ounce.
Economic Data & Market Sentiment
Dollar & Treasury Yields: The U.S. Dollar Index edged slightly higher, closing at 108.11 and hovering near a two-year high. Meanwhile, the 10-year Treasury yield briefly surpassed 4.6%, reaching a seven-month high before retreating slightly. Investors continue to evaluate the Federal Reserve’s interest rate policy and the potential impact of President-elect Trump’s trade policies.
Geopolitical Impact: Analyst Zain Vawda of OANDA highlighted that low liquidity is primarily influencing gold’s sideways movement. He added that geopolitical developments in 2025 could spark similar rallies, potentially pushing gold prices toward $2,800 per ounce.
Gold has performed exceptionally in 2024, achieving an all-time intraday high of $2,790 and on track for a 27% annual gain, the best since 2010. Factors such as central bank purchases, geopolitical tensions, and Federal Reserve rate cuts have supported this rally and set the stage for future gains in 2025.
Technical Analysis of Gold
Gold displayed a range-bound movement on Tuesday. Prices faced resistance near $2,621 and found support around $2,611. The daily chart shows a bearish candlestick, with moving averages still aligned for a downtrend. On the four-hour chart, the focus is on whether gold can stabilize and reverse on the weekly trend. If prices break below recent lows, further downside can be expected.

Today’s Focus & Strategy
- Key Support: $2,611–$2,605
- Recommended Strategy: Focus on short positions during rebounds, with long positions on pullbacks as a secondary approach.
- Key Resistance: $2,621–$2,628
Oil Market Overview
Crude oil prices rebounded on Tuesday, gaining over 1% due to improved short-term prospects and slightly tighter supply. WTI February crude futures rose $0.86, or 1.24%, to settle at $70.10 per barrel, while Brent February crude futures gained $0.95, or 1.31%, to $73.58 per barrel.
Economic Data & Market Sentiment
- Strong Economic Data: Recent U.S. economic data has been robust, fueling expectations of stronger oil demand. As the world’s largest oil consumer, the U.S.’s steady economic performance is a critical driver of crude demand. FGE analysts noted that December’s supply-demand dynamics have supported a less pessimistic outlook for oil prices.
- Inventory Data: Early Wednesday, API data showed U.S. crude and distillate inventories declined last week, while gasoline stocks increased. Crude inventories dropped by 3.209 million barrels, surpassing the expected decline of 2 million barrels. If this trend is confirmed by EIA data, it would reinforce expectations of tighter supply, providing further upside momentum for crude oil.
Supply Dynamics
The API data indicating a crude inventory decline highlights tighter supply conditions in December. U.S. crude production remains robust, as Baker Hughes reported an increase in operational rigs to 483, the highest level since September. If confirmed by EIA data, the drop in inventories could reinforce expectations of supply constraints and provide additional support to crude prices. However, despite tighter inventories, the broader supply-demand balance remains unresolved as markets anticipate further clarity from OPEC+ decisions and geopolitical developments.
Technical Analysis of Oil
Crude oil prices moved higher on Tuesday, stabilizing near $69.34 before advancing toward the $70.30 range. On the daily chart, oil prices continue to test the lower bounds of a wide trading range, showing no clear breakout. The medium-term chart indicates a potential double-bottom reversal pattern. Recent tests of prior lows have been met with strong support, but upward momentum remains weaker compared to earlier rebounds.

Today’s Focus & Strategy
- Recommended Strategy: Focus on buying at pullbacks, with selling on rebounds as a secondary approach.
- Key Resistance: $70.5–$71.0
- Key Support: $68.4–$67.9
Risk Disclosure:
Securities, Futures, CFDs and other financial products involve high risks due to the fluctuation in the value and prices of the underlying financial instruments. Due to the adverse and unpredictable market movements, large losses exceeding your initial investment could incur within a short period of time.
Please make sure you fully understand the risks of trading with the respective financial instrument before engaging in any transactions with us. You should seek independent professional advice if you do not understand the risks explained herein.
Disclaimer:
This information contained in this blog is for general reference only and is not intended as investment advice, a recommendation, an offer, or an invitation to buy or sell any financial instruments. It does not consider any specific recipient’s investment objectives or financial situation. Past performance references are not reliable indicators of future performance. Doo Prime and its affiliates make no representations or warranties about the accuracy or completeness of this information and accept no liability for any losses or damages resulting from its use or from any investments made based on it.


